Example: correcting an improper FWHM calibration
This section details the correction of a FWHM calibration, which was slightly off from the real value.
|
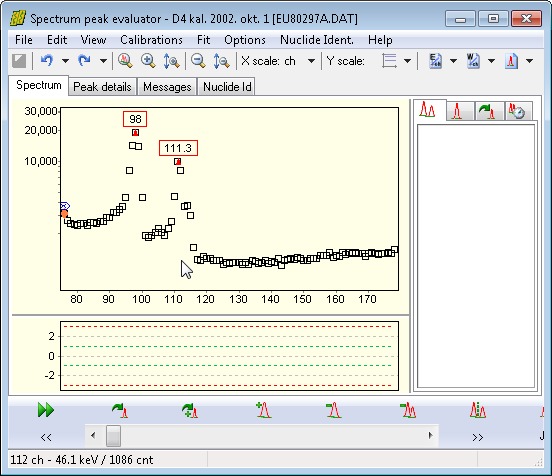
When a measurement is loaded into the peak evaluator, it is always advantageous to perform a quick check on the FWHM calibration before the spectrum deconvolution.
In order to get a visual overview of the current calibration, select Calibrations / FWHM calibration menu.
The FWHM Calibration Editor window appears now.
|
|
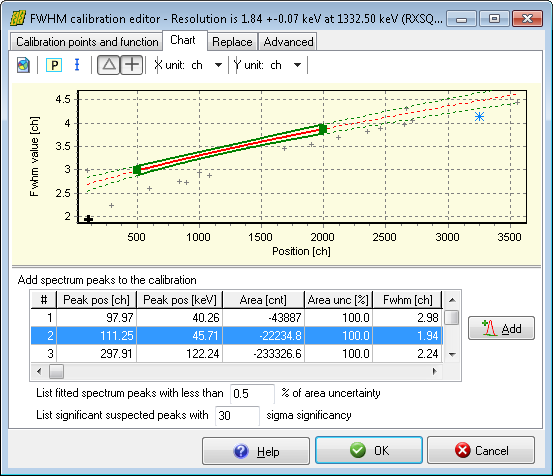
Click on the Chart tab.
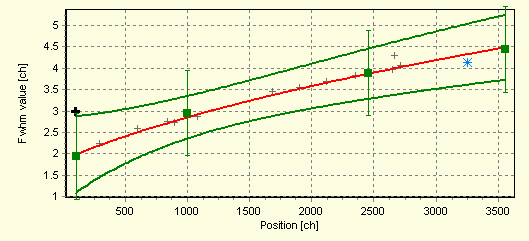
By the help of the chart, one can immediately characterize the situation:
numerous non-fitted (suspected) peak is available in the spectrum (gray + signs)
the non-fitted peaks spreads nicely along a square-root-shaped curve, so the construction of the FWHM curve is expected to be an easy task
no significant fitted peak is available at this moment (no gray Δ signs visible)
the current calibration curve (continuous red line) is determined from two data points (green squares)
|
|
|
It is immediately apparent the current calibration curve is sub-optimal:
the fitted FWHM curve differs significantly from the FWHM of the peaks (the red curve is above the gray crosses, especially in the low energy region): a slight mis-calibration is suspected,
the energy range of all the peaks are not well covered by the FWHM curve; in other words, in wide regions only extrapolation is provided,
only two calibration points have been utilized.
The solution for this problem should be the refinement of the current calibration points, and/or adding several ones in order to get a more relevant FWHM model.
Adding new points from list of available peaks
|
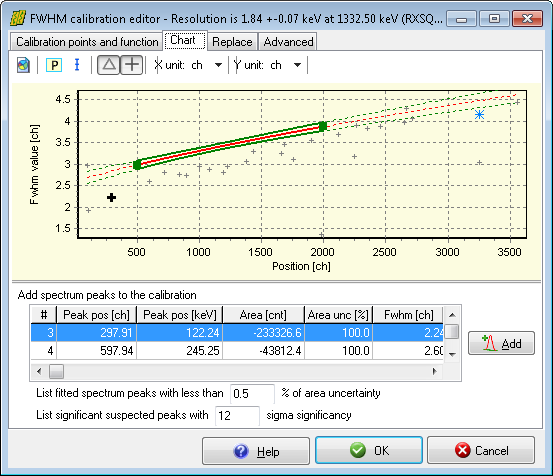
On the bottom of the Chart tab you can find the list of available peaks, which can be added to the FWHM calibration. This list contains the significant non-fitted and fitted peaks.
The list is filtered, so only the most relevant peaks (with the lowest area uncertainty) will be listed here. For non-fitted peaks the values will be estimated, and estimated peak areas displayed as negative values.
First we increased the filter significance: entered 30 as sigma, in order to dismiss the uncertain, small peaks on the graph.
Then we click over a proper candidate peak, and finally on the Add button. The selected peak will be added to the FWHM points, and a refit will be performed.
|
|
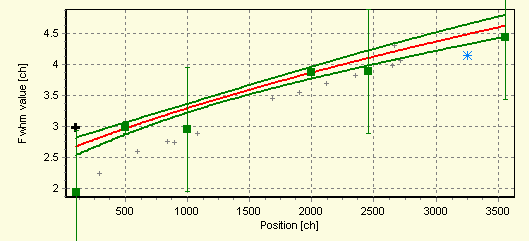
After adding 4 FWHM points, the fitted curve does not really follow the new points, but keeps following the old ones.
In order to find out the reason for this, switch on the error bars by clicking on the error bar button at the top.
This immediately shows the root of the problem: the old calibration points – which are originating from the spectrum file – have too low FWHM uncertainties, thus their fitting weights are unreasonably high.
|
As those points seems to be rather inaccurate in all respects, we will delete them.
|
To delete a point from a chart, simply click on its green square. After the click, the first tab will be active, and the clicked point's corresponding row will be selected. Now click the Delete button, thus remove the point from the fit.
After deleting the two original calibration points, the fitted FWHM curve reasonably well describes the measured points, so you can acknowledge it by clicking on the OK button, and perform the whole-spectrum deconvolution.
|
Note: HyperLab's spectrum fitter requires only a rough, approximate FWHM calibration, as it allows the peak width to vary by 30% from the FWHM calibration during the nonlinear fit. Nevertheless, a quick overview of the FWHM calibration is always advisable before fitting.