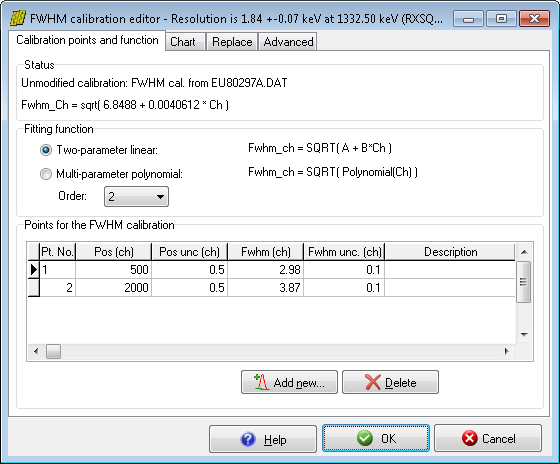
Basic FWHM editing operations
The first tab shows the input data for the calibration, as well as basic information about it.
These comprise the current status (modi­fied or unmodified), and the calibration point list as well. The point list contains two or more editable calibration points, to which a fit is performed, thus deter­mining a FWHM calibration curve, which basically has a square-root shape, and serves FWHM in channel units.
If the fitting function is linear, then a line will be fit to square of the input FWHM values. If only two input points are used, the line must go through both points. If more than two input points are specified, a least–square fit is performed, in order to determine the optimum calibration line between scattering points.
If the fitting function is a polynomial, then a polynomial curve is fitted to the data points. This requires n+1 input data points, where n is the degree of the polynomial, and is advised only if you have experienced significant deviation from a simple square-root FWHM curve.
Adding new points by visual selection
HyperLab makes it possible to quickly add a new calibration point via a convenient method. If you click Add new button under the list of calibration points, HyperLab displays the spectrum evaluation window, where you can click above a spectrum peak to get its FWHM value.
You can use this feature both for unfitted counts (raw channel content, as seen on this figure) and above fitted peaks. After clicking, the position and width of the peak will be used for a new FWHM calibration point. This way the addition of a new calibration point may be accomplished rather quickly.
Deleting points
To delete a specific FWHM calibration point, select it by clicking on it with the mouse, or make it active by pressing the up or down cursor arrow keys, and click Delete button.
FWHM chart for visual overview
A quick, graphical overview of the current calibration available on the Chart tab.
The FWHM calibration curve is disp­layed as a red line. The solid red line shows the FWHM function between the first and last calibration points, while the dashed one shows extrapolated regions. The green lines above and below the red curve shows the ±1σ uncertainties.
Calibration points used for the fitting of the FWHM curve are displayed as filled green squares. Available peaks are displayed as a gray triangle (Δ), if already fitted in the spectrum, or gray cross (+), if not fitted yet.
The chart also shows a blue star symbol for orienting the user: this is theoretically the 'best' achievable resolution: 1.7 keV at 1332 keV energy. Peak labels are provided by the [P] button.
 
 
Copyright © 1998-2024 by HyperLabs Software