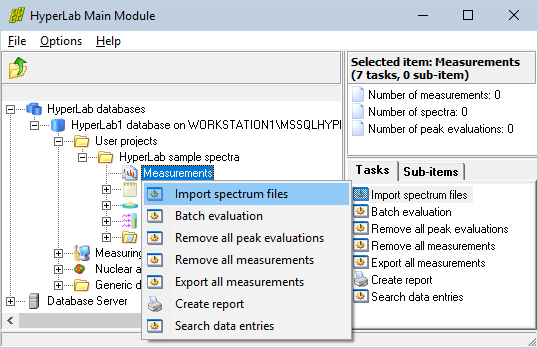
Then initiate the import of the sample spectra by right-clicking the Measurements node under the project and the select Import spectrum files from the pop‑up menu.
Then initiate the import of the sample spectra by right-clicking the Measurements node under the project and the select Import spectrum files from the pop‑up menu.
|
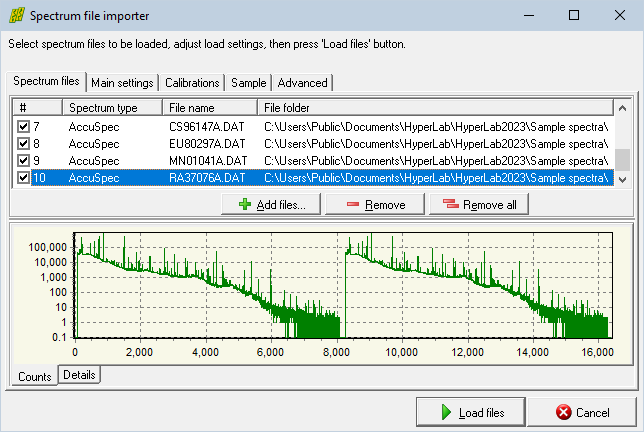 The Spectrum file importer window appears now.
Click Add files button, and select all 10 sample Accuspec spectra ending with “A” in their file name, as can be seen in the picture.
Click the Main settings tab now in order to specify details for your spectrum files.
|
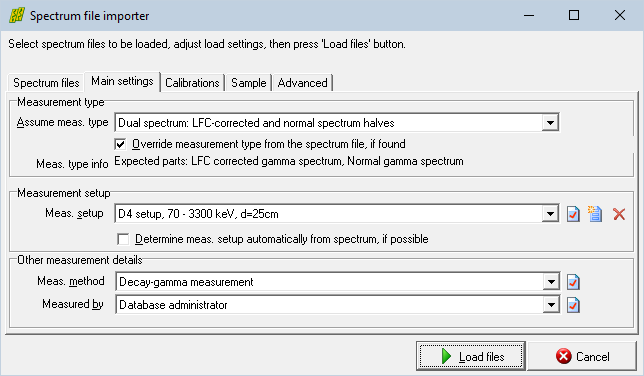 Here you should specify the Dual LFC spectrum evaluation mode first, as these measurements are created using an LFC module, allowing compensation for count losses due to varying or high count rate situations.
At the Measurement setup combo box, you should select HyperLab's sample measurement setup. This is an important setting, because all calibration analyses, e.g. the nonlinearity will belong to a specific setup, thus the calibration assignment can be automatic.
If the sample setup can not be found in the list, create it by clicking on the New entry button beside the combo box.
|
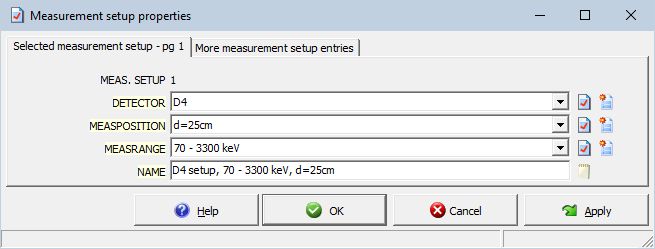 If creating of a new measurement setup is necessary, this entry editor will pop up. The editing can be done on the regular way, as described in the Importing spectrum files section of the Main Module Quick Start Guide.
When you are ready, click OK. The spectrum import form will appear again.
You should check the Calibrations tab now, where the source of FWHM and energy calibrations should be set to Spectrum files' own calibration values.
Click Load files button in order to initiate the spectrum loading.
|
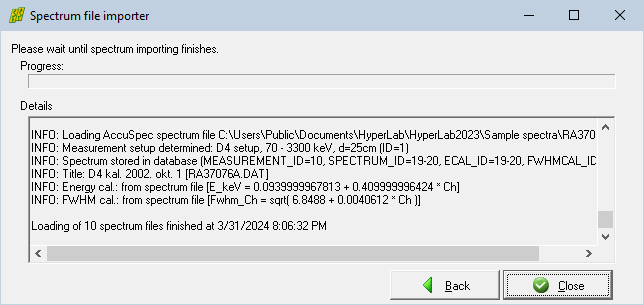 All selected spectrum files will be loaded now, and the importer will provide basic information on the loading process.
Click Close to finish loading.
|
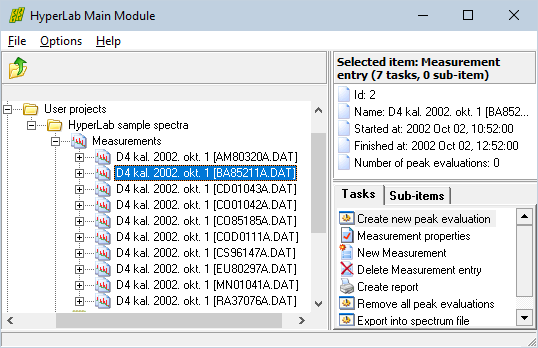 The database browser now displays the imported spectra. Now we will complete their missing sample settings.
Sample information is currently only used for calibration measurements, serving as input for later nonlinearity, efficiency and resolution analyses.
These analyses will identify gamma lines by using isotope information, which is in turn supplied by the user, during the sample definition.
|
Spectrum file
| Source name
| Isotope
| Activity
| Act. unc.
| Ref. date
|
AM80320A.DAT
| Am-241 OMH 80-320
| Am-241
| 221.50 kBq
| 1.0 %
| 1 Oct 1980
|
BA85211A.DAT
| Ba-133 OMH 85-211
| Ba-133
| 456.40 kBq
| 1.5 %
| 1 Oct 1985
|
CD01043A.DAT
| Cd-109 OMH 2001-043
| Cd-109
| 100.44 kBq
| 0.5 %
| 1 May 2001
|
CO01042A.DAT
| Co-57 OMH-01-042
| Co-57
| 32.63 kBq
| 0.5 %
| 1 May 2001
|
CO85185A.DAT
| Co-60 OMH 85-185
| Co-60
| 434.60 kBq
| 0.7 %
| 1 Oct 1985, 12:00
|
COD0111A.DAT
| Co-56 (Ref.:2001/11/1)
| Co-56
| -
| -
| -
|
CS96147A.DAT
| Cs-137 OMH 96-147
| Cs-137
| 20.75 kBq
| 1.5 %
| 1 Dec 1996, 12:00
|
EU80297A.DAT
| Eu-152 OMH 80-297
| Eu-152
| 250.30 kBq
| 2.0 %
| 1 Dec 1980
|
MN01041A.DAT
| Mn-54 OMH 2001-041
| Mn-54
| 18.98 kBq
| 0.5 %
| 1 May 2001
|
RA37076A.DAT
| Ra-226 PTB 370-76
| Ra-226
| 112.00 kBq
| 0.667 %
| 1 Jan 1978
|
Pb-214, Bi-214
| -
| -
| -
|
 To define a source for a measurement, click the measurement and select its Measurement properties task. The measurement's property editor window appears now.
Please check if its Source field is set. If there is no reference to an existing source, or the Measurement object type field does not set to Source, then please define the source properties for measurements.
|
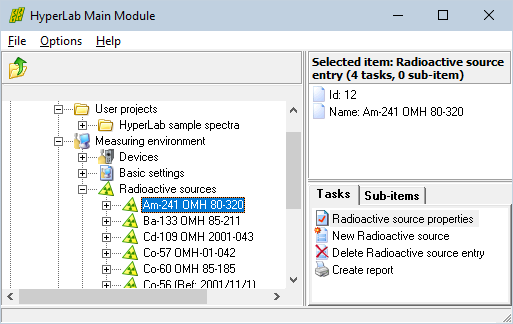
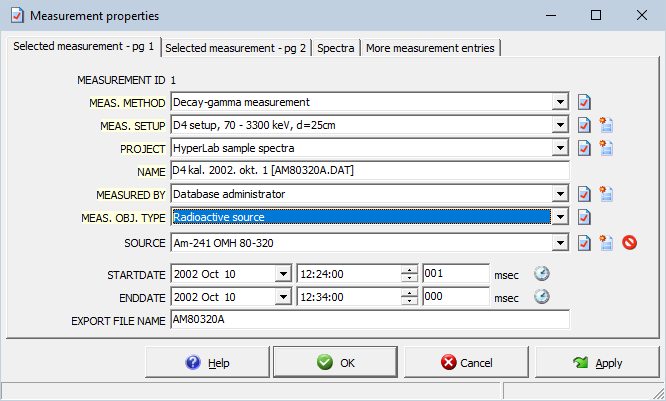 Set the Measurement object type field to Radioactive source, and check in the list of Source field's combo if the searched source is already defined. If it is already in the list, then select it, and click OK to finish editing of measurement entry.
If the source list does not contain the searched source, click the Create new source entry button beside the combo box.
|
 |