Detector efficiency analysis
HyperLab is able to automatically construct absolute or relative full-energy detector efficiency functions (curves) from multiple measurements taken with multiple radioactive sources. The applied state-of-the-art techniques result in a single detector efficiency polynomial, and also its exactly computed uncertainty values throughout the used energy range. This provides significant advantage over HyperLab's competitors.
Efficiency curve
The semiconductor detectors' efficiency means a ratio between the number of photons arriving into the detector and the number of detected events resulting at the end of the measurement chain. As the probability of gamma photon detection changes rapidly with the energy of the photons, it is common to describe the logarithmic of the efficiency as a function of the logarithmic of the photon energy.
|
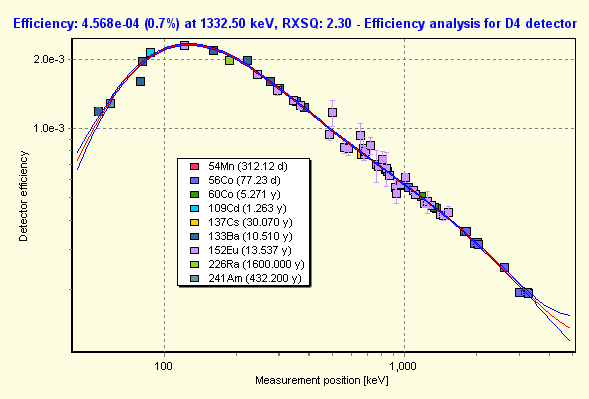
HyperLab also uses this log(Eff) vs. log(E) fitting and displaying method in its Detector efficiency analysis module, as you can see in this figure.
The curve itself is depicted by a red line, its ±1σ limit with blue lines, while the measured intensity points are either not normalized (if an absolute calibrated radioactive source is used) or normalized (in case of home-made sources).
|
The calculated detector efficiency may be used for generating special peak list reports, which contains peak areas and uncertainties with efficiency correction. HyperLab also uses the efficiency curve for nuclide identification.